
Key messages

  • Over 70% of Estonia's waste comes from the oil shale industry.
  • While per capita municipal waste generation is below the EU average, the resource potential of this waste remains underexploited.
  • Separate collection of municipal waste improves the quality of waste materials, thereby enhancing their recycling potential.
  • The transition to a circular economy reduces the environmental pressure, dependence on imported raw materials, and business risks in export markets.

ok


State

  • In 2022, 22.85 million tons of waste was generated in Estonia. The total waste generation includes waste from all sectors, such as municipal waste, construction and demolition waste, oil shale industry waste, etc. Source: Environmental Agency, 2023
  • In Estonia, 2.5 times more waste was generated per capita than the EU average, primarily due to the high waste volumes from the oil shale sector. According to 2020 data, 12 163 kg of waste per capita was generated in Estonia, compared to the EU average of 4 815 kg. Only Luxembourg, Sweden, Bulgaria, and Finland reported higher figures. Source: Eurostat, 2023
  • The growth of waste generation was lower than economic growth between 2018 and 2020, meaning the waste generation index was lower than the GDP index for both total waste and municipal waste. The decrease in the waste generation index compared to economic growth indicates that waste generation was not directly linked to GDP growth. This decoupling can be attributed to factors such as increased consumer awareness, more efficient resource use, and the implementation of circular economy principles. For an overview of waste generation and economic growth in the European Union, visit the European Environment Agency (EEA) website.

ok

  • In Estonia, approximately 64% of all generated waste was recycled, 34% was landfilled, and 1% was incinerated. In comparison, in the EU an average of 39% was recycled, 32% landfilled, and 7% incinerated. Estonia`s high recycling rate was significantly influenced by the production of crushed stone from oil shale waste and the high recycling rate of construction and demolition waste, which stands around 90%. However, a considerable share of recycling involves backfilling, even though material reuse should be prioritised. Sources: Eurostat 2022, Estonian Environment Agency 2023

  • In 2021, 42% of plastic packaging waste was recycled (the current target is 22.5%, increasing to 50% by 2025), and 70% of all packaging waste was recycled (the current target is 55%, rising to 65% in 2025). Explore EU packaging waste statistics here and Estonian packaging waste statistics here. Source: Estonian Environment Agency, 2023

  • In 2022, the circular material use rate in Estonia was 16%, meaning that 84% of materials used in the economy came from primary raw materials. In the European Union, the rate was 11.5%. Compared to other world regions, Europeans have used higher share of recycled materials. Learn more here.

Explore EU waste statistics here.

ok

? Do you know the difference between recycling, recovery, and the circular economy?

  • Recycling means giving new life to materials that have become waste. It involves processing waste into new products, materials, or substances. For example, plastic packaging waste can be recycled into a wide variety of new products – bottles, boxes, pipes, fleece fabrics, etc.
  • Recovery includes both recycling (including preparing for reuse), as well as using waste for backfilling and incineration with energy recovery.
  • Circular economy is an economic model that focuses on the efficient use of resources and reducing waste generation. Products, components, and materials are kept at their highest possible useful value.

Ma pole siinses tõlkes kindel

  • While per capita municipal waste generation is below the EU average, the resource potential of this waste remains underexploited.
  • In 2022, the amount of municipal waste generated per capita in Estonia was 27% lower than the EU agerage – 373 kg in Estonia compared to the EU average of 513 kg. Source: Eurostat, 2023
  • In 2022, 33% of municipal waste was recycled in Estonia, compared to 48% in the European Union (the current target is 50%, increasing to 55% from 2025). Sources: Eurostat, 2023; Estonian Environment Agency, 2023.
  • The more waste we collect separately and sort, the more we can recycle and reuse it. In 2022, 38% of municipal waste in Estonia was collected separately, including waste sorted by waste handlers. The majority of municipal waste was either incinerated for energy recovery or landfilled. In other words, the resources contained in 62% of municipal waste were lost to Estonian society in 2022. Learn more about separate collection of municipal waste here.
  • Approximately one-third of the municipal waste mass consists of bio-waste, and about another third is packaging. According to the national waste sorting study, the collection of bio-waste, plastic packaging, and paper and cardboard separately has the greatest impact on achieving recycling targets.
  • Estonia has an efficient deposit package return system through which nearly 90% of single-use plastic beverage bottles placed on the market are collected, exceeding the target set for 2025 (77%). An overview of PET bottle collection across the European Union is available on the UNESDA website.

ok

According to the European Environment Agency (EEA), there is a risk that most member states will not achieve the municipal waste and all packaging waste recycling targets set for 2025. Nine member states are on track to meet both targets, eight member states (including Estonia) are at risk of failing to meet the municipal waste target, and ten member states may not achieve either target. Read more in the early warning report prepared for Estonia.

ok


Pressure

  • Over 70% of Estonia`s waste is generated by the oil shale industry.
  • Considering trends in the climate sector, it can be expected that the generation and share of waste from the oil shale industry will decrease in the future.
  • An estimated 65% of municipal waste was generated in seven municipalities: the cities of Tallinn, Tartu, Pärnu, Narva, and Maardu, as well as Rae and Saue municipalities (Estonia has 79 municipalities in total). Source: Environmental Agency, 2023.

  • The reduction of municipal waste generation largely depends on public awareness and consumption habits. According to the Environmental Awareness Survey, 90% of Estonians reported separate collection of municipal waste, and 83% did so frequently. However, the national waste sorting study showsed that mixed municipal waste still contained a large share of recyclable materials. This indicates a low level of public awareness regarding proper waste separation.

ok

  • The construction sector includes all construction and demolition waste, including soil removed from contaminated land.
  • The waste management and wastewater treatment sector includes waste generated by waste management companies, external wastewater treatment plants, and the handling of drinking and industrial water.
  • The agriculture, forestry, and fishing sector includes waste generated in agriculture, horticulture, aquaculture, forestry, hunting, fishing, and food production and processing.
  • The wood industry sector includes waste generated during wood processing, production of boards and furniture, and the production of pulp, paper, and cardboard.
  • Municipal waste includes household waste and similar waste from commercial, industrial, and public authority activities (including separately collected waste).

ok
 

Impacts

  • The transition to a circular economy reduces the environmental pressure, dependence on imported raw materials, and business risks in export markets.
  • Today’s linear economic model (“take-make-dispose”) relies on natural resources, is energy-intensive, and brings us closer to a raw material crisis.
  • Although the waste sector accounts for 3% of total greenhouse gas emissions, efficient resource use helps reduce emissions in other sectors as well.
  • According to the World Bank, natural resource shortages is among the top ten global risks for the next decade. Based on a 2023 study, the number of raw materials considered critical for the functioning of the European Union’s industry, economy, and society has increased from 14 in 2011 to 34. Notably, 90% of these critical raw materials originated from China. In some cases, the concentration of materials in waste can be higher than in natural mineral ores.
  • Among Estonia’s top export destinations are Finland, Sweden, the Netherlands, and Norway – nations aiming to be global leaders in these areas. Lagging behind in waste management and the circular economy reduces the competitiveness of Estonian companies in export markets.
  • Waste generation has various negative environmental impacts. For example, landfilled and storaged oil shale waste poses a threat to groundwater quality. In Ida-Viru County, the Ordovician and Quaternary groundwater bodies are affected by pollutants characteristic of the oil shale industry, such as mono-substituted phenols, sulphates, and, in certain areas, also petroleum products, polycyclic aromatic hydrocarbons (PAHs), and benzene. An overview of the status of surface and groundwater bodies is available here.
  • Widespread microplastic pollution has resulted from plastic use over the past 60 years. An estimated 14 million tonnes of microplastics have accumulated in the world’s oceans, while their actual impact on ecosystems, wildlife, and human health remains largely unknown. Read more here and here.

ok


Measures

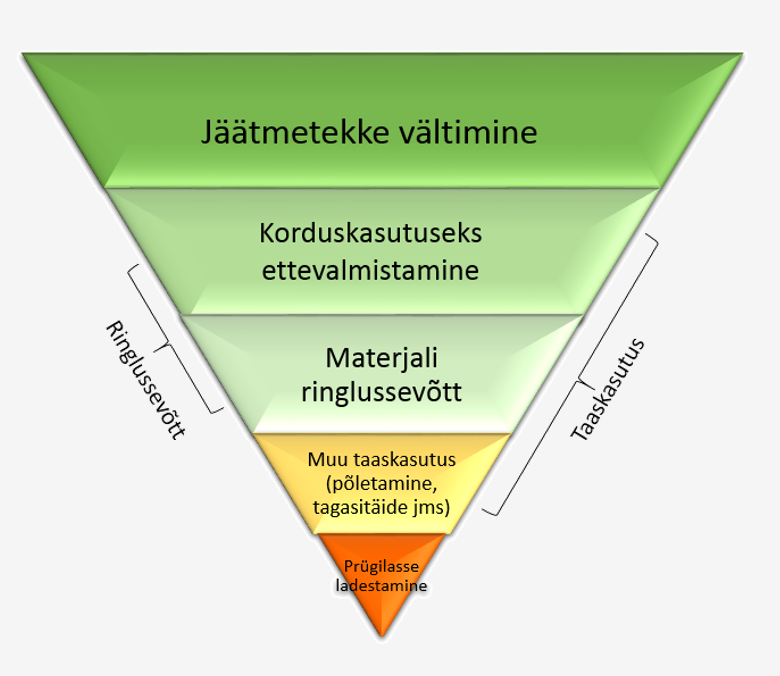
Waste management is based on the waste hierarchy — a principle aimed at minimising the environmental impact of waste by prioritising solutions that are higher up in the hierarchy.

  • Estonia’s strategic goals and measures for waste management are set out in the National Waste Plan 2023–2028 (Chapter 3). For example, the share of construction and demolition waste generation should be reduced by 10% through selective demolition of buildings and the separate collection and reuse of materials generated on construction and demolition sites.
  • Estonia aims to update its legislation on waste, packaging, and related environmental charges by 2025 and to reach a 10% share of reusable packaging by 2028. Explore the Green Reform Action Plan.
  • Since May 1, 2023, the placing on the market of single-use plastic products such as cotton swab sticks, cutlery, plates, straws, drink stirrers, balloon sticks, food and drink packaging made of expanded polystyrene, and drink cups has been prohibited. Read more about the Single-Use Plastics Directive .
  • Product design must ensure that plastic caps of single-use plastic beverage containers remain attached to the container after opening. Starting from 2025, single-use plastic beverage containers must contain recycled plastic.
  • Estonia contributes to achieving the UN Sustainable Development Goal to halve per capita global food waste in retail and consumption by 2030 and to reduce food loss along production and supply chains. Estonia’s Food Waste Prevention Plan is included in Annex 2 of the National Waste Plan 2023–2028. Read more about food waste and prevention opportunities here.
  • Information about the plan to make textile products more durable, repairable, reusable, and recyclable can be found in the EU strategy for sustainable and circular textiles and on the Ministry of Climate’s website.
  • Olmejäätmetest tuleb alates 2025. aastast korduskasutuseks ette valmistada ja ringlusse võtta vähemalt 55% ning aastatel 2030 ja 2035 vastavalt 60% ja 65%.  Nende eesmärkide täitmiseks on Kliimaministeerium algatanud 2023. aastal jäätmereformi. Loe olmejäätmete liigiti kogumisest lähemalt Kliimaministeeriumi veebilehelt ja tutvu jäätmete raamdirektiiviga siin.

J22tmepuramiid

  • Pakendijäätmetest tuleb korduskasutuseks ette valmistada ja ringlusse võtta vähemalt 65% 2025. aastast ja 70% 2030. aastast. Loe pakenditest edasi Kliimaministeeriumi veebilehelt. 
  • Uue patareide ja akude ning patarei- ja akujäätmete määruse alusel on keelatud kogutud patarei- ja akujäätmete kõrvaldamine ja taaskasutamine energia eesmärgil. Lisaks peavad tootjad koguma kantavate patareide ja akude jäätmeid 2027. aasta lõpuks 63% ja 2030. aasta lõpuks 73% ning kergtranspordivahendite patarei- ja akujäätmeid 2028. aasta lõpuks 51% ja 2031. aasta lõpuks 61%. Loe edasi ja tutvu täiendavate eesmärkidega siin.
  • Vähemalt 70% ehitus- ja lammutustegevuses tekkinud tavajäätmete hulka kuuluvatest ehitus- ja lammutusjäätmetest (va kivid ja pinnas ning süvenduspinnas) tuleb alates 2020. aastast taaskasutada korduskasutuseks ettevalmistatuna, ringlussevõetuna või muul viisil, sealhulgas tagasitäiteks, muude materjalide asemel. Tutvu jäätmete raamdirektiiviga siin. 
  • Prügilasse ei tohi vastu võtta ega ladestada rehve, tööstuslike ja mootorsõidukite patareide ja akude jäätmeid, sortimata olmejäätmeid ning ladestatavate olmejäätmete hulgas ei tohi olla biolagunevaid jäätmeid üle 20%. Alates 2035. aastast ei tohi prügilatesse ladestada enam kui 10% tekkivatest olmejäätmetest. Allikad: Jäätmeseadus ja kasutatud patareide ja akude käitlusnõuded.
  • Materjalide ohutut ringlussevõttu toetab Stockholmi konventsioon, mis keelustab ja piirab kõige ohtlikumate püsivate toksiliste orgaaniliste ühendite tootmist ja kasutamist. Muuhulgas on keelatud ka antud ühendeid sisaldavate jäätmete ringlussevõtt. 

Euroopa Liidu ja Eesti eesmärk on liikuda tõelise ringmajanduse suunas, mis oleks energia- ja ressursisõltumatu, vastupidavam väliste šokkide suhtes ning looduse ja inimeste tervisega arvestav.  

  • Lähtuvalt Euroopa rohelisest kokkuleppest võeti Euroopa Liidus 2019. aastal vastu ringmajanduse tegevuskava, mille eesmärk on kestlike toodete arendamine ja tootmisprotsessides ringluse tagamine, tarbijate mõjuvõimu suurendamine, võtmesektoritele keskendumine ja jäätmete vähendamine. 
  • 2050. aasta eesmärgiks on Euroopa Liidu majanduse kasv viisil, mis arvestab ressursipiiranguid ja planeedi piire, panustades ülemaailmsesse majanduse muutmisse. Loe edasi ressursitõhusa Euroopa tegevuskava visioonist. 
  • 2050. aasta eesmärgiks on muuta Euroopa Liidu praegune toidusüsteem kestlikumaks. Euroopa toidu tervislikumaks ja kestlikumaks muutmine on ELi strateegia “Talust taldrikule” peamine eesmärk. 
  • Euroopa Liidu turul kestlike toodete kättesaadavus ja teave teadlike tarbimisvalikute tegemiseks on üks tarbijakaitse tegevuskava eesmärkidest. 
  • Kemikaalidele ja toodetele töötatakse välja ohutut ja kestlikku disaini arvestavad kriteeriumid Euroopa Liidu kemikaalistrateegia raames. 
  • Toitainete kestlikum majandamine, sealhulgas põllumajanduse produktiivuse tagamine ja toitainete kao vähendamine Läänemerre HELCOMi riikides on käsitletud Läänemere toitainete ringlussevõtu strateegias. 
  • Eesti ringmajanduse tegevuskavaga tutvu lähemalt siin ning rahastusvõimalustega ringmajanduse edendamiseks SA Keskkonnainvesteeringute Keskuse koduleheküljel. 
  • Eesti eesmärgiks on 2035. aastaks saavutada ringleva materjali määr 30% ning aastaks 2050 asendada lineaarne majandusmudel ehk „tooda-tarbi-viska minema“ ringmajandusega. Tutvu rohereformi tegevusplaaniga siin. Ohutu materjaliringluse suurendamine on ka üheks kolmest Riigi jäätmekava 2023-2028 strateegilisest eesmärgist.  

Ringmajandus

Published: 07.03.2024  /  Updated: 13.06.2025